Published by Joe Webster
Last updated Dec, 16 2025
Local moving remains the most common form of residential relocation in the United States, with millions of households moving within the same metropolitan regions each year. As of late 2025, shifting housing markets, remote work flexibility, affordability pressures, and demographic changes are reshaping local moving behavior and these trends will carry into 2026 and beyond.
According to the latest U.S. Census Bureau mobility data, more than half of all U.S. moves occur locally rather than across state lines, making local moving activity the largest share of overall relocation demand nationwide. While long-distance moves often attract more attention, local moves drive the majority of industry volume, influencing cost benchmarks, workforce utilization, and seasonal demand dynamics.
This 2026 dataset compiles authoritative, U.S.-based statistics on local moving, including how many people move locally each year, average local moving costs and rate benchmarks, key drivers of estimates, seasonality and timing insights, and regional demand patterns. All figures are grounded in government and industry sources and structured for use in research, citation, and long-term dataset visibility.
Local Moving in the U.S.
Local moves account for the largest share of residential relocation activity in the United States, reflecting how Americans most often move within the same city, county, or state. Entering 2026, local mobility continues to be shaped by housing affordability, rental turnover, employment shifts, and lifestyle-driven relocations rather than long-distance migration alone.
According to the most recent U.S. Census Bureau geographic mobility data, overall moving rates remain below historic highs, but local moves consistently represent the majority of all U.S. relocations, making them the primary driver of demand across the moving industry.
Key local moving statistics:
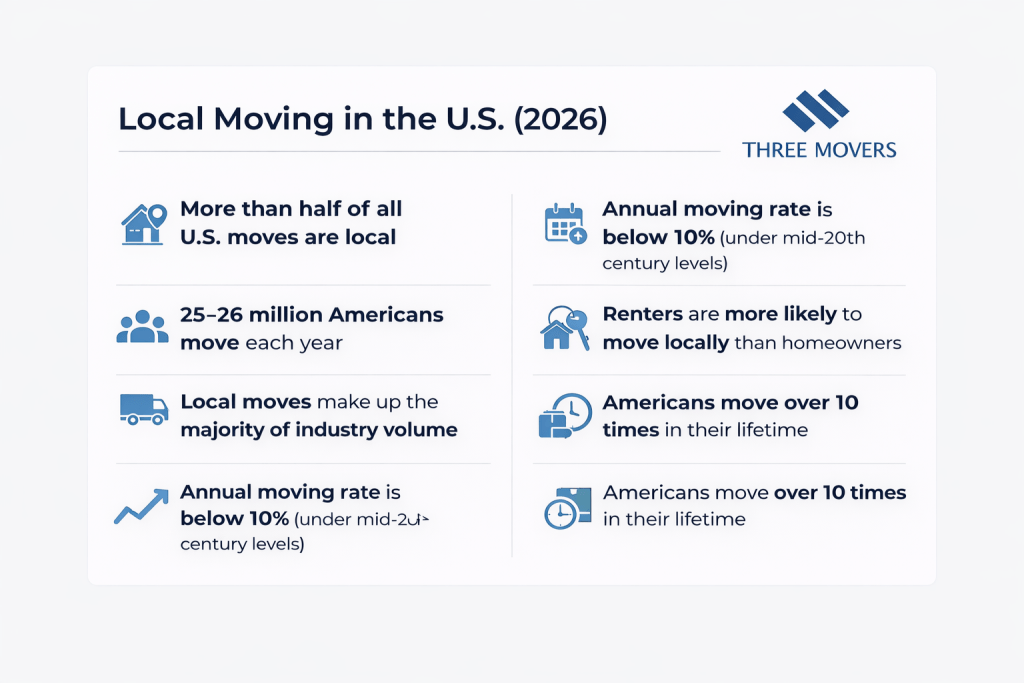
- More than half of all U.S. moves are local, meaning households relocate within the same county or metropolitan area rather than across state lines.
- Approximately 25–26 million Americans move each year, with local moves accounting for the largest portion of that total.
- The national annual moving rate remains under 10%, down from peaks of nearly 20% in the mid-20th century, reflecting longer home tenures and aging demographics.
- Renters are significantly more likely to move locally than homeowners, driven by lease cycles, rent increases, and housing availability.
- Local moves generate the majority of moving industry volume, even though long-distance moves typically produce higher revenue per shipment.
- The average lifetime mobility rate in the U.S. remains high, with Americans moving more than 10 times over their lifetime, most often locally.
- Urban and suburban markets account for the highest concentration of local moving activity due to population density and housing turnover.
How Many People Move Locally Each Year (2026)
Each year, tens of millions of Americans change residences, with local moves accounting for the majority of this activity. As the U.S. enters 2026, overall mobility remains historically low compared to past decades, but local relocation continues to dominate due to housing transitions, rental turnover, and short-distance lifestyle moves.
Data from the U.S. Census Bureau’s geographic mobility reports shows that while Americans are moving less frequently than in the mid-20th century, most moves that do occur happen locally, reinforcing the central role of local movers in the housing and relocation ecosystem.
Key statistics on local moving volume in the U.S.:
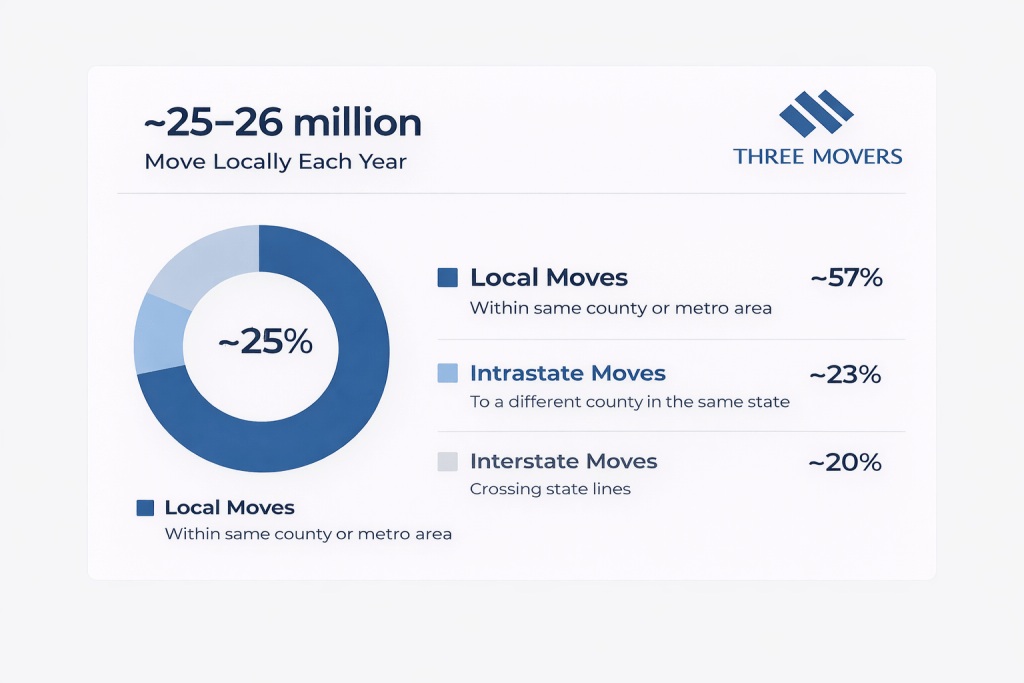
- Approximately 25–26 million Americans move each year, representing under 10% of the total U.S. population.
- More than 50% of all U.S. moves are local, meaning households relocate within the same county or metropolitan area.
- An additional 20–25% of moves occur within the same state, but to a different county, reinforcing the dominance of short-distance relocation.
- Interstate moves account for less than one in five relocations, making them a minority compared to local moves by volume.
- The national moving rate has steadily declined from nearly 20% in the 1950s to below 10% entering 2026, driven by longer homeownership tenure and aging demographics.
- Renters represent the most mobile population segment, with significantly higher local moving rates than homeowners.
- Despite lower overall mobility, local moving volume remains stable, supported by lease cycles, urban density, and regional housing turnover.
Local Moving Costs & Rate Benchmarks
Local moving costs in the U.S. are primarily driven by labor time, crew size, and regional pricing, rather than distance-based mileage formulas used for long-distance moves. As the industry enters 2026, local moving rates continue to reflect inflation-adjusted labor costs, urban demand density, and seasonal availability.
Unlike interstate moves, which are priced by weight and distance, local moves are typically billed hourly, making cost predictability closely tied to home size, access conditions, and total hours worked.
Key local moving cost benchmarks in the U.S.:
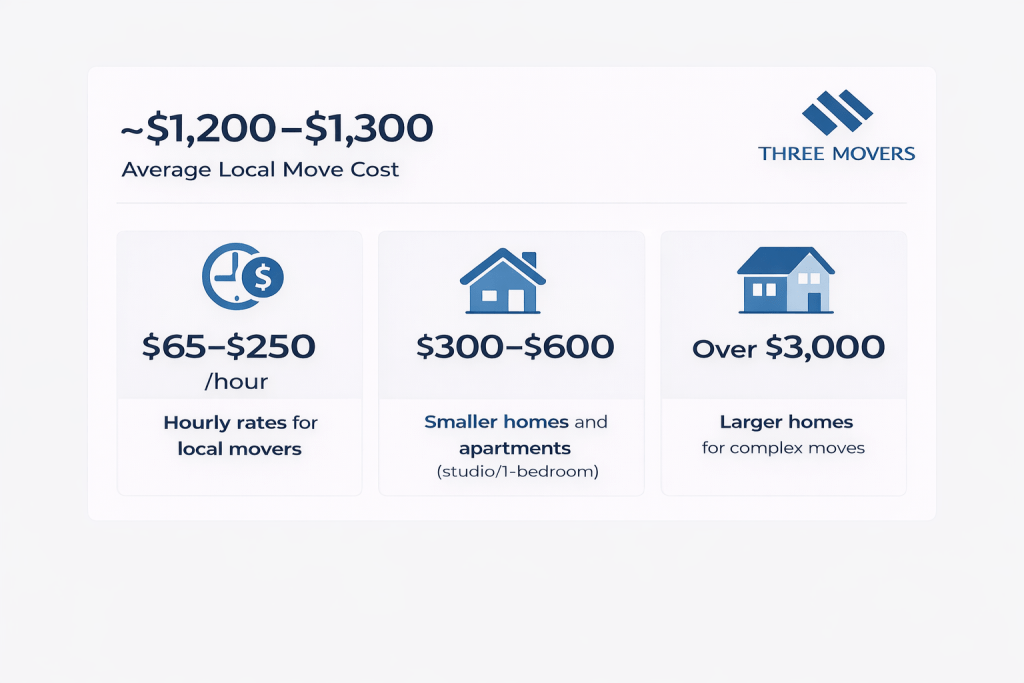
- The average cost of a local move in the U.S. is approximately $1,200–$1,300, depending on home size and location.
- Hourly rates for local movers typically range from $65 to $250 per hour, based on region, crew size, and demand levels.
- Smaller homes and apartments (studio or 1-bedroom) often fall in the $300–$600 range, while larger homes can exceed $3,000 for complex local moves.
- Urban and high-cost metro areas consistently see higher hourly rates due to labor costs, insurance, and congestion-related inefficiencies.
- Crew size and labor hours account for the majority of total cost, with more belongings, stairs, long carry distances, or specialty items increasing billable time.
- Additional services, such as packing, furniture disassembly, or specialty item handling, can materially raise local moving costs beyond base labor rates.
- Compared to interstate moves, local moves generate lower revenue per shipment, but represent the highest volume of transactions across the moving industry.
What Impacts Local Moving Estimates
Local moving estimates are primarily influenced by time-based and access-related factors, rather than mileage alone. As the industry moves into the next year, pricing accuracy continues to depend on how well movers can forecast labor hours, crew requirements, and logistical complexity before moving day.
Unlike long-distance relocations, where weight and distance dominate pricing, local move estimates are highly sensitive to on-site conditions, making detailed surveys and disclosures critical for cost predictability.
Key factors that influence local moving estimates:
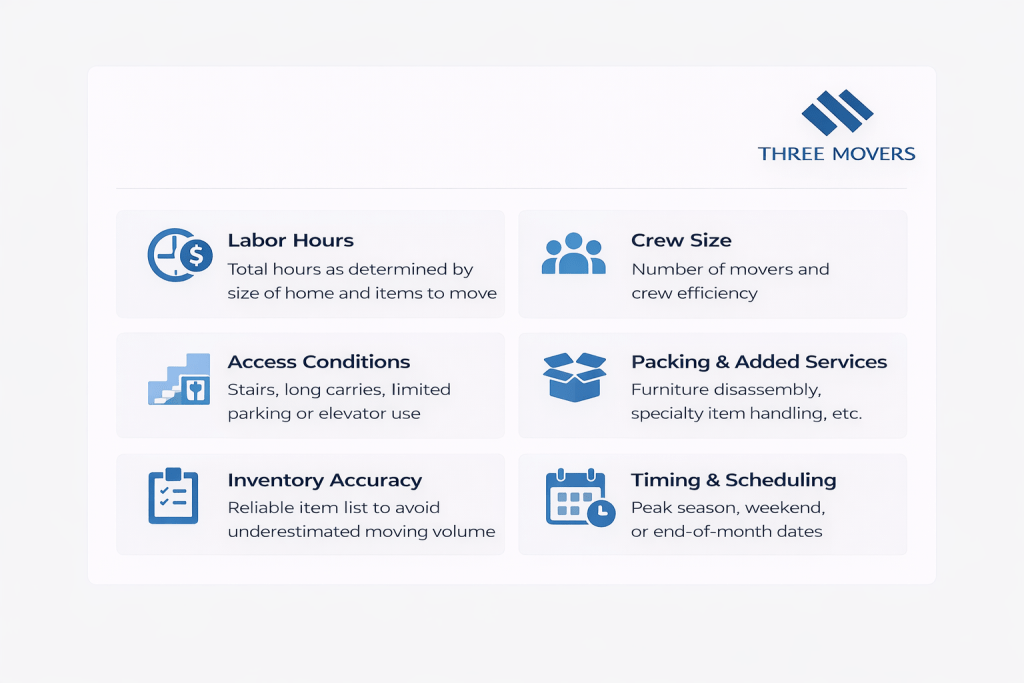
- Labor hours are the single largest cost driver, with total time determined by home size, volume of belongings, and packing requirements.
- Crew size directly impacts hourly cost, as larger crews raise the per-hour rate but may reduce total move time for larger homes.
- Access conditions, such as stairs, elevators, long carry distances, or limited parking, significantly increase labor time and estimated cost.
- Packing and additional services, including furniture disassembly, reassembly, or specialty item handling, can materially raise estimates beyond base labor rates.
- Accuracy of the inventory plays a major role, as underestimating volume is a leading cause of estimate overruns on moving day.
- In-home or video surveys consistently produce more accurate estimates than phone-only or online-only quotes, particularly for multi-room homes.
- Timing and scheduling factors, such as peak season, weekends, or end-of-month dates, often result in higher estimated costs due to increased demand and limited crew availability.
Best Time of Year to Move Locally
Timing plays a major role in local moving costs, availability, and overall experience. As the U.S. enters 2026, local moving activity continues to follow strong seasonal and calendar-based patterns, driven by school schedules, lease cycles, weather conditions, and housing turnover.
While local moves occur year-round, demand is heavily concentrated within specific months, weeks, and days, creating predictable pricing and availability fluctuations across the moving industry.
Key seasonality and timing insights for local moves:
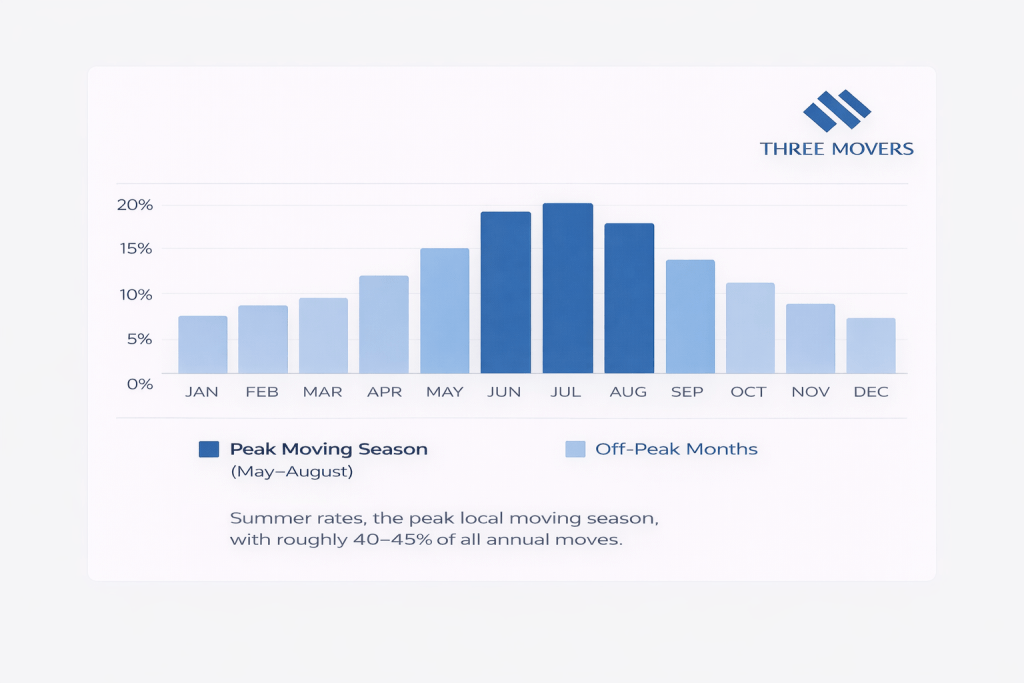
- Summer remains the peak local moving season, with roughly 40–45% of all annual moves occurring between May and August.
- June consistently ranks as the busiest moving month, accounting for the largest single share of yearly relocations.
- Winter months see the lowest moving activity, with December typically representing the slowest month for local moves due to holidays and weather conditions.
- End-of-month dates experience the highest demand, driven by lease expirations and housing closings clustered around the 30th and 31st.
- Mid-month moves (around the 10th–20th) often offer better availability and lower pricing due to reduced competition.
- Weekday moves are generally less expensive and easier to schedule than weekend moves, which carry premium demand.
- Off-season and mid-week scheduling remains the most reliable way to reduce local moving costs and secure preferred time slots.
Regional Demand for Local Movers (Top Cities & States)
- Local moving demand is not evenly distributed across the United States. In 2026, regional demand continues to concentrate in high-population metros, fast-growing states, and areas with strong rental turnover, job growth, or net inbound migration.
- Urban density, housing affordability, and lifestyle-driven relocation patterns play a central role in determining where local movers experience the highest year-round demand.
- Key regional demand trends shaping local moving:
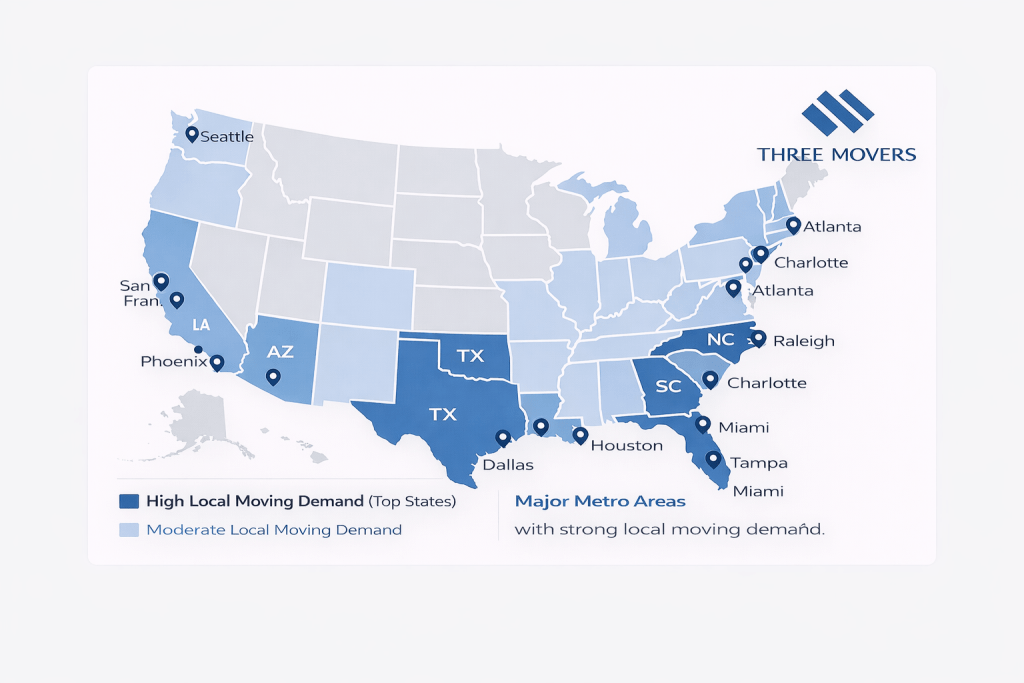
- Large metropolitan areas generate the highest volume of local moves, driven by population density, apartment turnover, and frequent intra-city relocations.
- Sun Belt states including Texas, Florida, Arizona, North Carolina, and South Carolina continue to see elevated local moving demand due to population growth and housing development.
- High-cost coastal metros experience strong local moving activity despite outbound migration, largely driven by renters relocating within the same region rather than leaving the state.
- College towns and military-adjacent regions produce consistent local move volume tied to academic calendars, deployments, and short-term housing cycles.
- Suburban markets surrounding major cities show rising local move demand as households relocate within metro areas for space, affordability, or school access.
- States with high renter populations consistently experience higher local move frequency compared to states with higher long-term homeownership rates.
- While interstate migration shapes headlines, local and intrastate moves account for the majority of regional moving demand across nearly all states.
Residential vs Commercial Local Moves
The local moving market in 2026 is still dominated by residential demand, but the way households complete local moves varies widely based on cost sensitivity, home size, and complexity. While commercial local moves (offices, retail, small warehouses) represent meaningful revenue opportunities, household relocations remain the primary driver of volume.
Another defining characteristic of the U.S. local moving landscape is that most moves do not use full-service movers, especially for short-distance relocations where DIY options remain practical.
Key statistics and trends across residential vs commercial local moves:
- Residential moves account for the majority of local moving volume, driven by lease turnover, housing transitions, and intra-metro relocation.
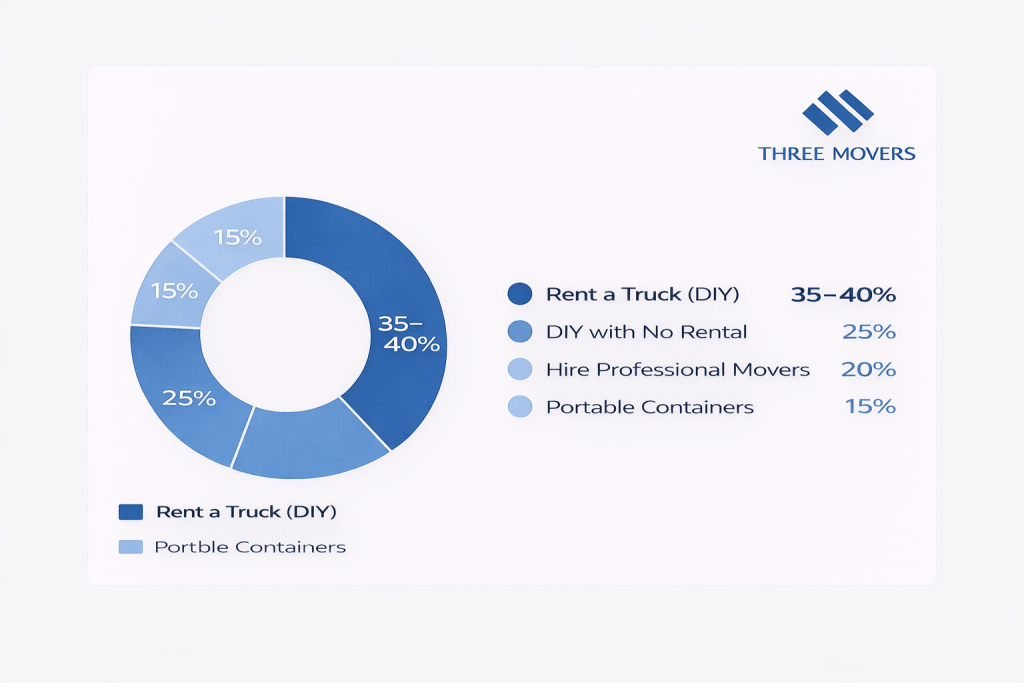
- Only about 1 in 5 movers hire professional movers, while the rest choose DIY approaches, especially for shorter-distance moves.
- In consumer surveys, roughly 35–40% rent a moving truck and complete the move themselves, reflecting strong price sensitivity in local moves.
- Approximately 15% of movers use portable containers (pods-style services), balancing DIY packing with outsourced transportation.
- A significant share of local movers handle relocations with no paid services at all, relying on personal vehicles, family help, or informal labor.
- Commercial local moves tend to be more schedule-driven, often occurring during off-hours or weekends to reduce downtime.
- For commercial relocations, labor coordination, equipment handling, and time constraints are typically more important than distance, similar to residential local moves.
Future Outlook for Local Moving
The outlook for local moving services beyond 2026 is shaped by a combination of housing market conditions, demographic shifts, labor availability, and technology adoption. While Americans are moving less frequently than in past decades, local relocation demand remains structurally resilient due to life events, rental turnover, and urban mobility.
Rather than rapid expansion, the local moving industry is expected to experience steady, demand-driven activity, with gradual operational and pricing adjustments.
Key trends shaping the future of local moving:
- Housing affordability and mortgage rates will remain the most influential factors affecting local move volume, with easing conditions likely increasing relocation activity.
- Millennials entering peak household formation years are expected to sustain long-term demand for local moving services, particularly in metro and suburban markets.
- Labor constraints may continue to pressure availability and pricing, especially during peak season, as the industry competes for physically demanding, short-tenure labor.
- Technology adoption is accelerating, with increased use of virtual surveys, digital inventory tools, and scheduling automation improving estimate accuracy and operational efficiency.
- DIY competition is expected to persist, particularly for small local moves, reinforcing price sensitivity and service differentiation across movers.
- Environmental considerations are gaining traction, including reusable moving containers, route optimization, and early adoption of electric vehicles for short-distance moves.
- Regulatory oversight and consumer protection efforts are likely to expand, improving transparency and trust while raising compliance expectations for licensed movers.