Published by Chris Townsend
Last updated Jan, 19 2026
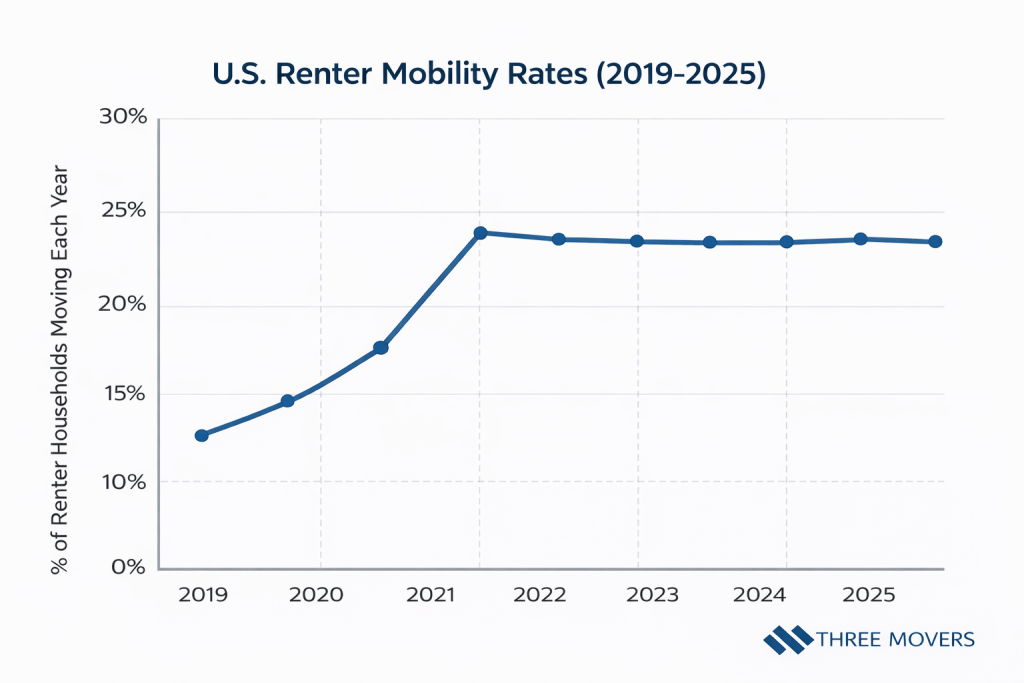
U.S. Renter Mobility Rates (2019–2025)
Renter mobility has historically been higher than homeowner mobility in the United States, reflecting the short-term and flexible nature of apartment living. This section examines how often U.S. renters moved between 2019 and 2025, capturing both pre-pandemic norms and post-pandemic stabilization.
- Between 2019 and 2024, approximately 20–26% of renter households moved each year, according to U.S. Census Bureau mobility data.
- Renter mobility rates declined sharply in 2020, falling closer to 20%, as pandemic-related restrictions reduced relocation activity.
- Mobility rebounded in 2021, with renter move rates rising back above 25%, reflecting delayed relocations and labor market recovery.
- From 2022 through 2024, renter mobility gradually stabilized, remaining within a 21–24% range annually.
- Younger renter households consistently accounted for the largest share of moves, reinforcing the link between renting and short-term housing tenure.
- Across the 2019–2025 period, renters were more than twice as likely to move in a given year compared to owner-occupied households, based on Census mobility comparisons.
Seasonal Apartment Moving Patterns
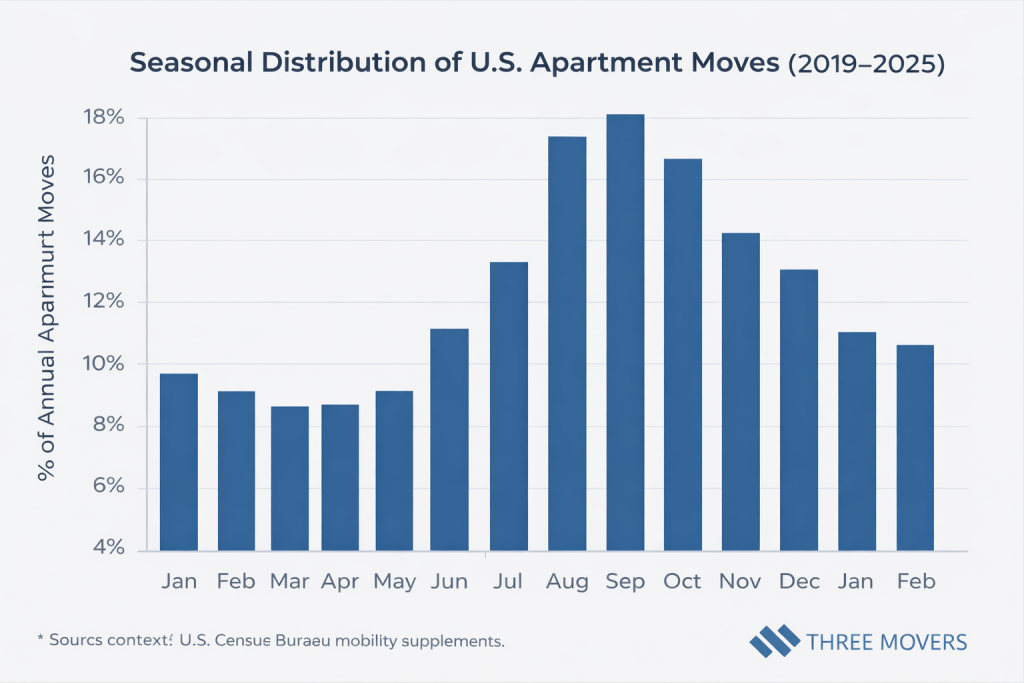
Apartment moving activity in the United States follows a strong seasonal cycle, driven by lease expirations, school calendars, and weather conditions. This section examines how renter moves are distributed throughout the year, highlighting consistent peak and low-moving periods between 2019 and 2025.
- Approximately 40–45% of all apartment moves occur during the summer months (May through August), making this the busiest moving season for renters.
- July consistently records the highest share of apartment relocations, accounting for roughly 12–14% of annual renter moves in most years.
- Moving activity begins rising sharply in April, coinciding with the end of winter leases and the start of peak hiring seasons.
- Winter months (December through February) represent the slowest period, typically accounting for 15–18% of annual renter moves combined.
- Seasonal moving patterns remained consistent before and after the pandemic, despite overall mobility fluctuations.
- College calendars and urban lease cycles play a significant role in amplifying summer apartment turnover, particularly in large metro areas.
Demographics of Apartment Movers
Apartment moving behavior varies significantly across demographic groups, particularly by age and household composition. This section examines which renter segments are most likely to relocate, based on U.S. mobility and housing survey data from 2019 to 2025.
- Renters aged 20–29 consistently recorded the highest mobility rates, with annual move rates often exceeding 35%.
- The 30–39 age group followed closely, with mobility rates typically ranging between 25–30%, reflecting job-related and family-driven relocations.
- Mobility rates declined steadily with age, with renters aged 50 and older moving at rates below 15% annually.
- Single-person renter households were significantly more mobile than family households, accounting for a disproportionate share of apartment moves.
- Households with children exhibited lower apartment mobility rates, reflecting longer lease tenures and school stability considerations.
- Across all years studied, younger renters accounted for the majority of apartment relocations, reinforcing the link between renting, early career stages, and housing flexibility.

Reasons Renters Move Apartments
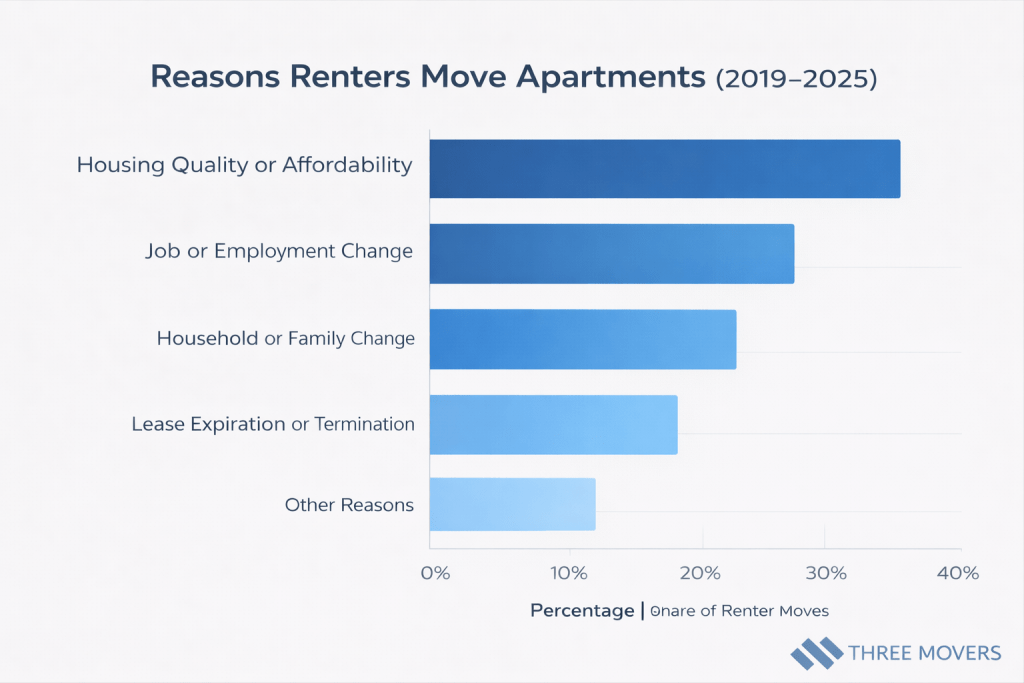
Apartment relocations are influenced by a combination of economic, employment, and household-related factors. This section outlines the most commonly reported reasons U.S. renters moved apartments between 2019 and 2025, based on national housing and mobility surveys.
- Housing-related reasons such as seeking a better unit, lower rent, or improved neighborhood conditions accounted for approximately 35–40% of apartment moves.
- Employment-related changes, including new jobs or job transfers, drove roughly 20–25% of renter relocations during the period.
- Household and family changes, including marriage, separation, or changes in household size, contributed to about 15–20% of apartment moves.
- Lease-related factors, such as lease expiration or non-renewal, were cited in roughly 10–15% of renter moves.
- Cost pressures, including rent increases, became a more prominent driver of apartment moves after 2021, particularly in large metropolitan areas.
- Despite economic shifts, the overall distribution of move reasons remained relatively consistent from 2019 through 2025.
Apartment Moving Distance & Relocation Scope
Most apartment relocations in the United States occur over relatively short distances, reflecting local housing market dynamics and lease-driven mobility. This section examines how far renters typically move when changing apartments, based on national relocation and mobility data from 2019 to 2025.
- An estimated 65–70% of apartment moves occurred within the same county or metro area, indicating that most renters relocate locally.
- Approximately 15–20% of renters moved to a different county within the same state, often tied to employment changes or housing affordability.
- Interstate apartment moves accounted for roughly 10–15% of renter relocations, representing longer-distance household moves.
- The average distance for apartment relocations remained relatively stable across the study period, despite pandemic-era migration shifts.
- Urban renters were significantly more likely to relocate locally, while interstate apartment moves were more common among younger and remote-enabled households.
- Even during peak migration years, long-distance apartment relocations remained a minority of total renter moves.

Key Takeaways
- Between 2019 and 2025, renter households consistently moved at significantly higher rates than homeowners, with annual apartment mobility rates generally ranging between 20% and 26%.
- Apartment moving activity follows a strong seasonal pattern, with summer months accounting for nearly half of all renter relocations each year.
- Younger renters, particularly those aged 20–39, represented the most mobile segment of apartment households and accounted for the majority of moves.
- Housing-related factors, including affordability and unit quality, were the most commonly cited reasons for apartment moves, followed by employment-related changes.
- Most apartment relocations were local in nature, with roughly two-thirds of renters moving within the same county or metro area.
- Despite short-term disruptions during the pandemic period, overall apartment mobility patterns remained structurally consistent across the study period.